How to choose the tastiest chocolate bar!
A data driven guide to craft chocolate
Chidi Olewuenyi
We’ve all been there. Standing in front of a wall of chocolate, wondering why one costs $7 and the other $15. You pick up a bar from Madagascar. Put it down. Reach for one from Peru instead. Maybe it’s the cocoa percentage, maybe it’s the minimalist packaging, maybe it’s just vibes, but somehow, you have to decide which is the best to buy.
When we look at the data from over 2,500 professional tastings and ratings of chocolate, the story gets more complicated. This guide will give some tips on what to look for in your chocolate.
To pick the best bar, you may want to look at two things: the bean’s origin (where it grew) and the manufacturer’s location (where it was made).
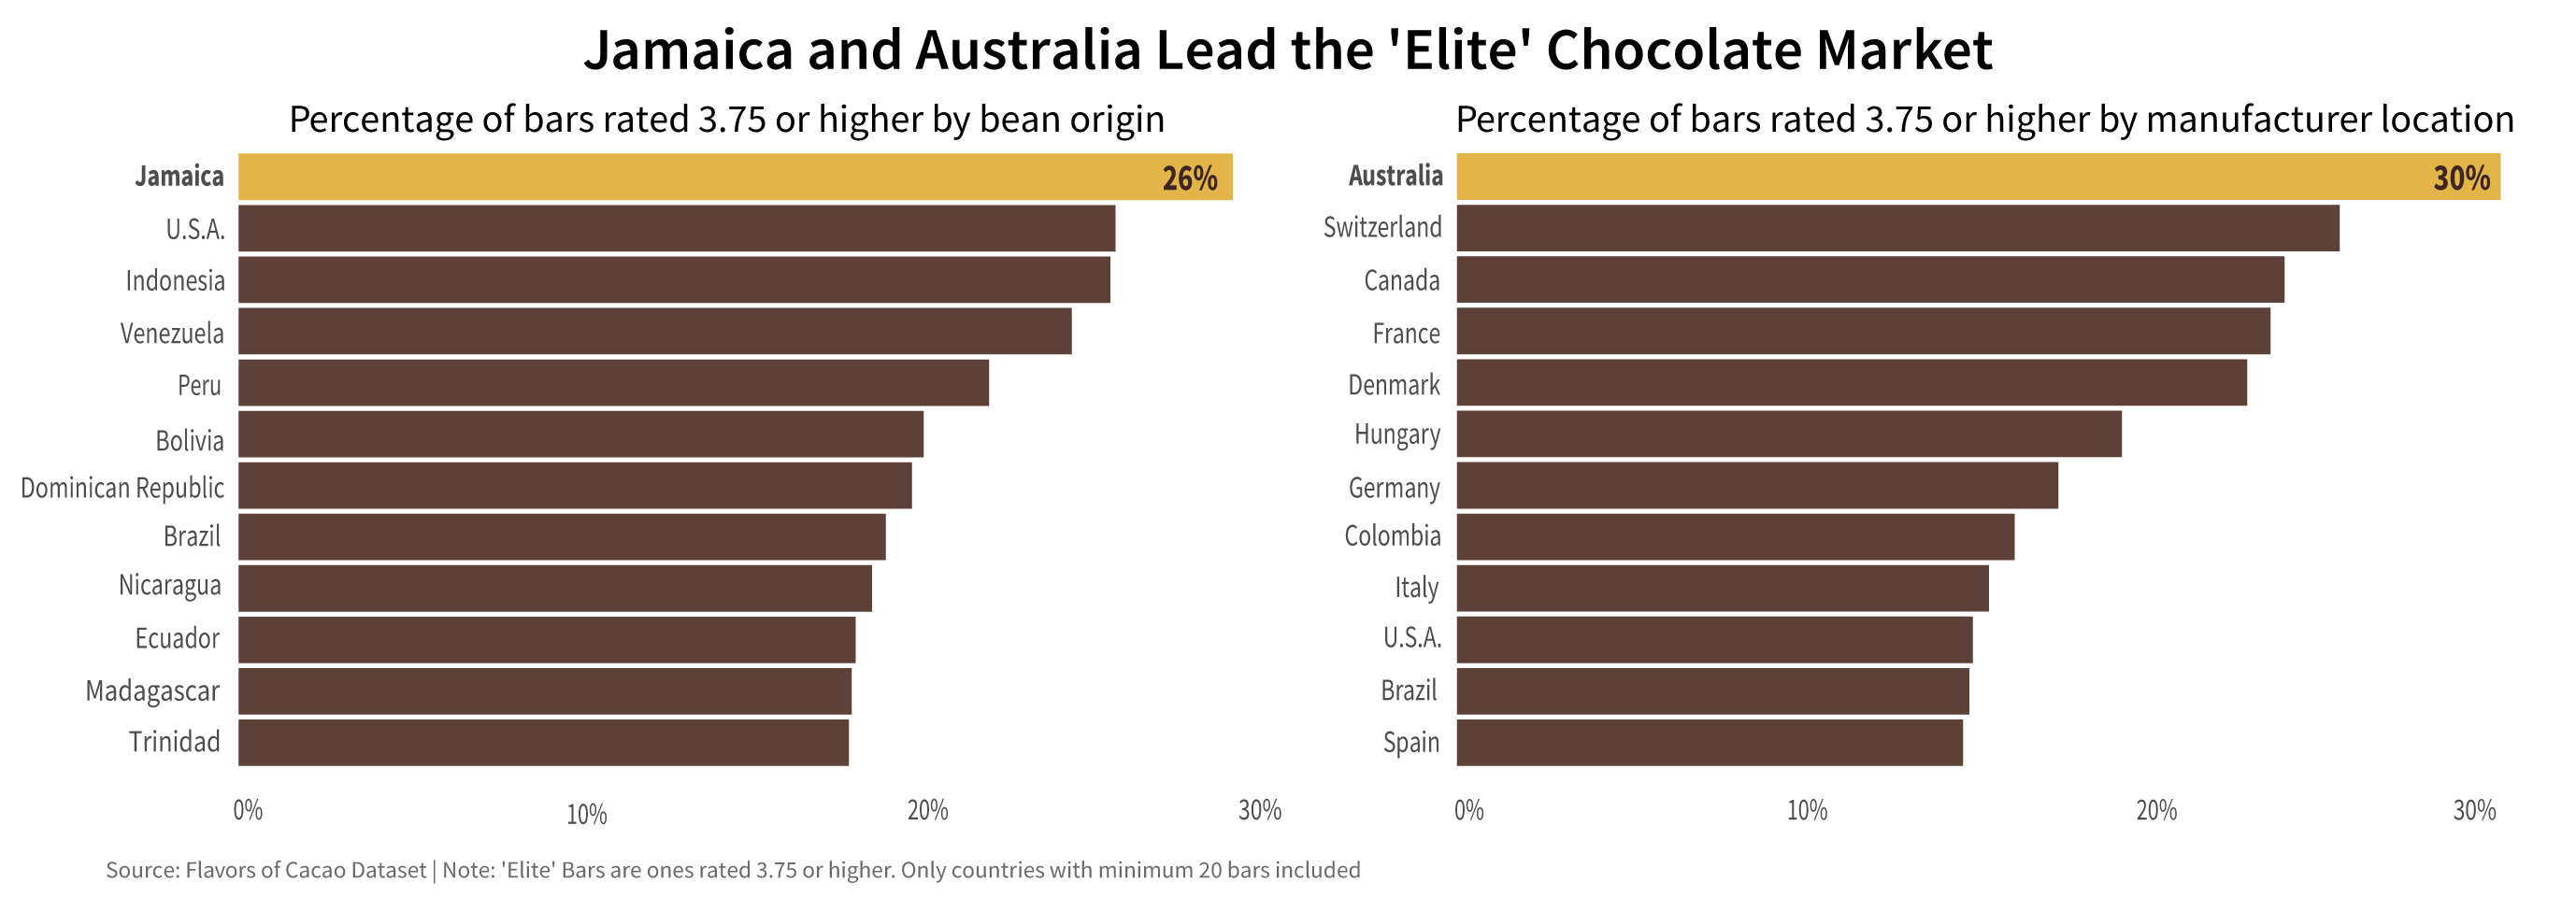
The ratings point to two clear winners. Jamaica is the most prestigious origin for beans, and while they may be far from the cocoa belt, Australian makers are the ones to look out for.
To find the truly elite bars, we have to look at where the bean and the maker collide. By mapping manufacturer against bean origin, we found the "Sweet Spots" of global trade.
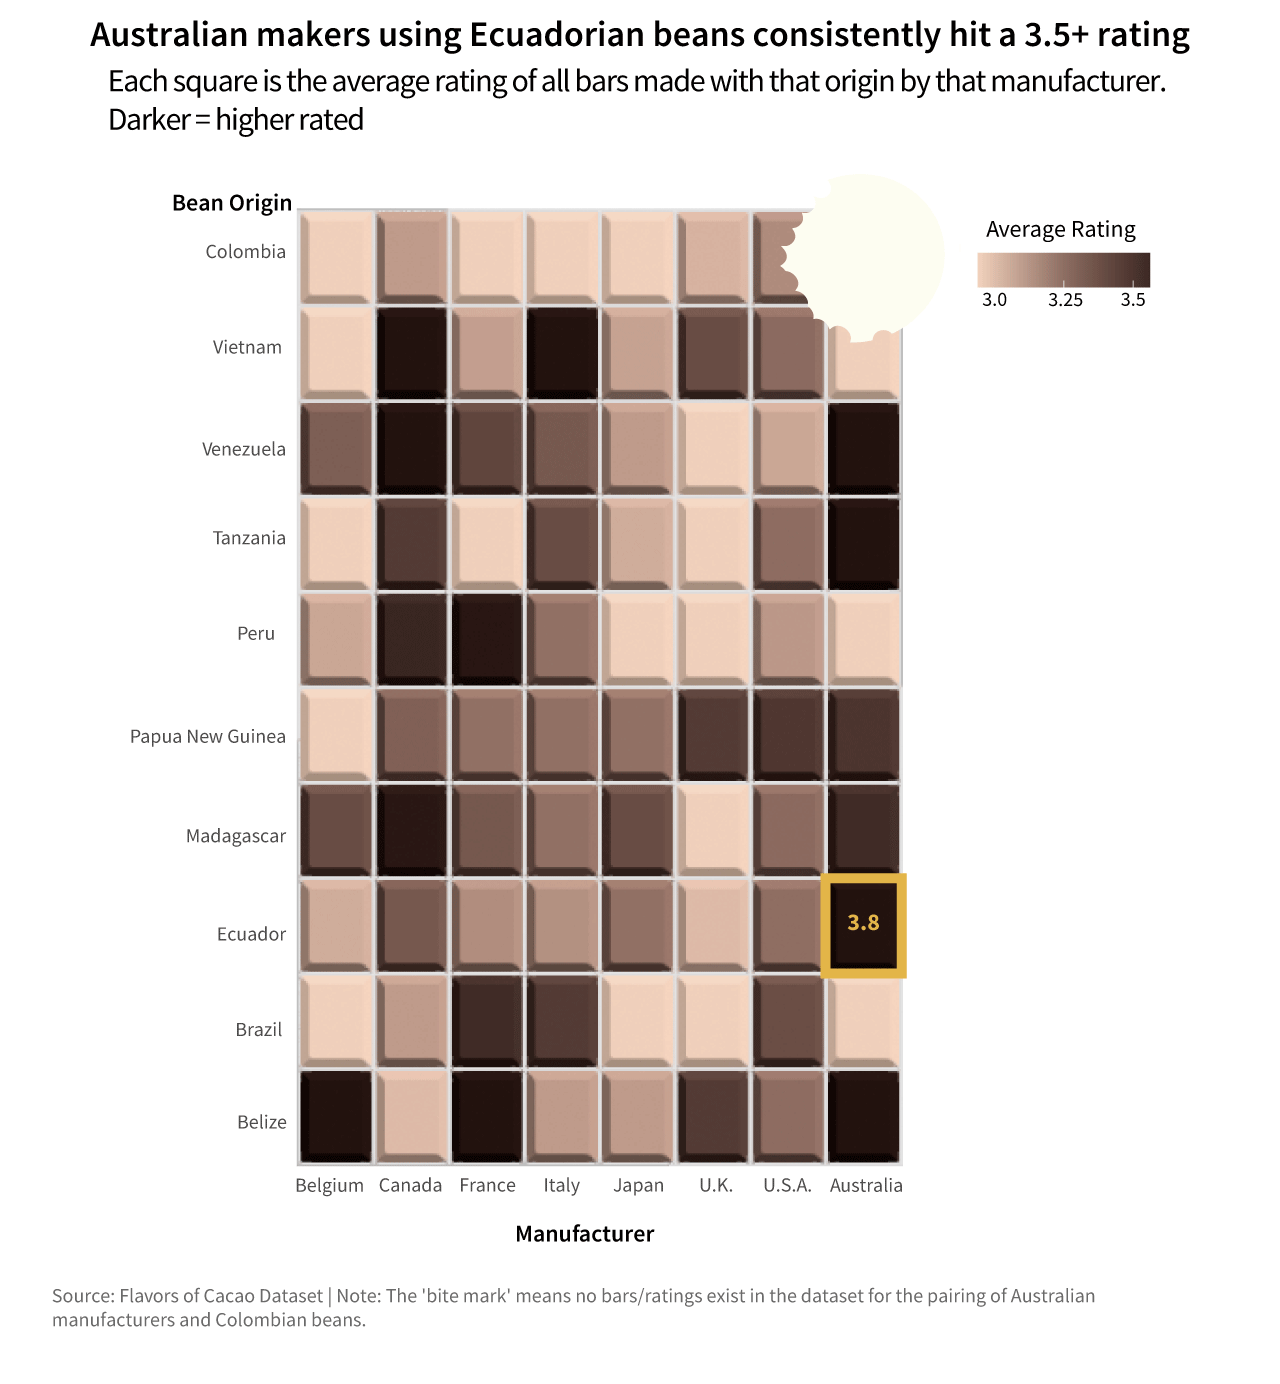
The darker the piece of chocolate, the higher the rating. If you spot a bar where the bean and the maker align on this map, you’ve found a winner. Check out that gold-boxed corner, specifically: Australia and Ecuador. Building on our findings that Australian makers lead the world in quality, this heatmap identifies their specific pairing with Ecuadorian beans. Australian makers who use Ecuadorian beans have an average chocolate bar rating of 3.8! Some other pairings to look out for in a good bar of chocolate: Belgium & Belize, Canada & Venezuela, and France & Peru.
(Notice the "bite" out of the corner? That’s not just for show. It represents a gap in the market. Currently, no professional ratings exist for the pairing of Australian makers and Colombian beans.)
If you want a single rule to follow without analyzing the entire supply chain, another reliable metric is the cocoa percentage. There's a common assumption that if you aren't eating 99% cocoa, you aren't a real chocolate connoisseur. However, these expert ratings tell a different story.
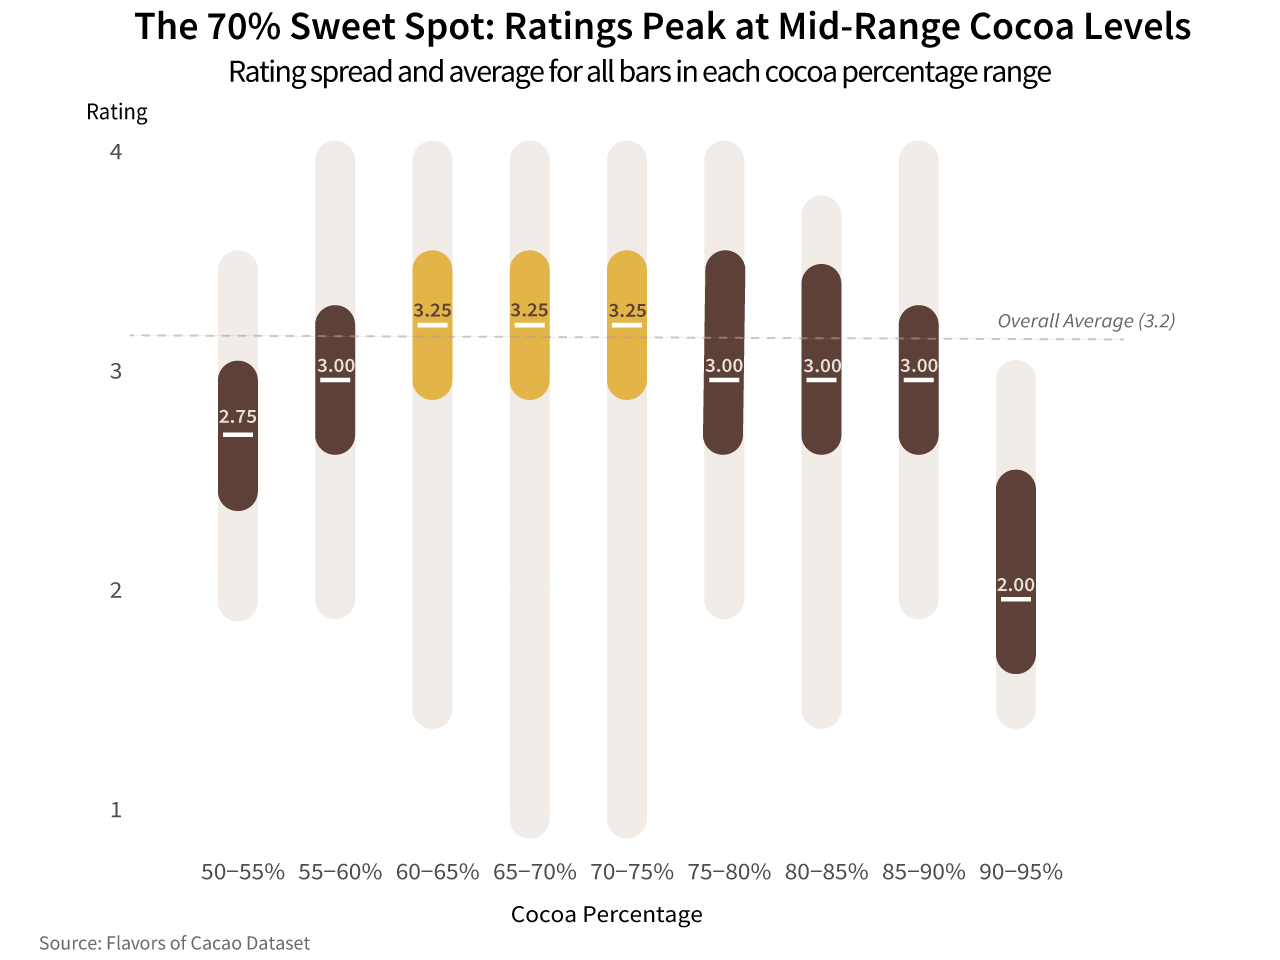
When we plot the ratings across the cocoa spectrum, a clear peak emerges at 60% to 75%. This is the "Sweet Spot." It’s dark enough to be sophisticated, but sweet enough to actually, you know, enjoy.
At lower and higher percentages, especially 90% and above, the pattern changes. Ratings drop, and choosing these bars is a much riskier choice. If you want a guaranteed win, stay in the gold.
The Final Verdict
Here's what to look for in the chocolate aisle:
- Bean Origin Only: Jamaican beans produce the most chocolate rated 3.75+.
- Manufacturer Only: Look for an Australian manufacturer. They produce the most chocolate rated 3.75+.
- Bean Origin + Manufacturer: Find an Australian bar using Ecuadorian beans.
- Cocoa Percent: Stay in the 60–75% cocoa range. These bars rank higher, on average, compared to higher or lower percentages.
The next time you find yourself in front of a wall of gold foil and wrappers, don’t let the jargon intimidate you. You now have the guide. All that’s left to do is buy the bar, break the seal, and see if the data tastes as good as it looks!
About this story
This dataset consists of over 2500 ratings of craft chocolate bars. The data includes cocoa bean origin, manufacturer location, cocoa percent, review date, number of ingredients, tasting characteristics, and rating from 1 to 5. The dataset comes from Flavors of Cacao’s chocolate database and is maintained by the Manhattan Chocolate Society, but I found it on Data is Plural originally.
Made for Data 1500 Final Narrative Project.